Nov 14, 2025
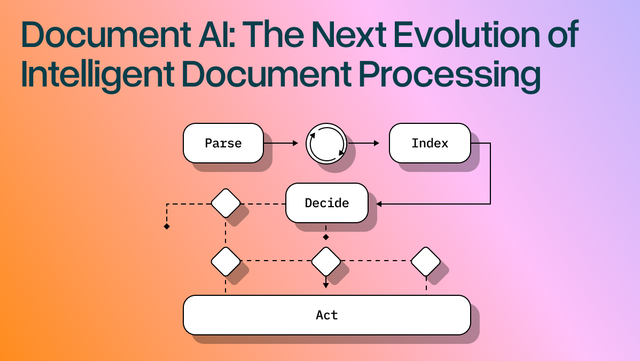
Document AI: The Next Evolution of Intelligent Document ProcessingPersona
Industry
Use cases
Chart Data Extraction AI
[ Chart Data Extraction AI ]

Use LlamaParse to turn charts into clean JSON with citations and confidence you can trust.
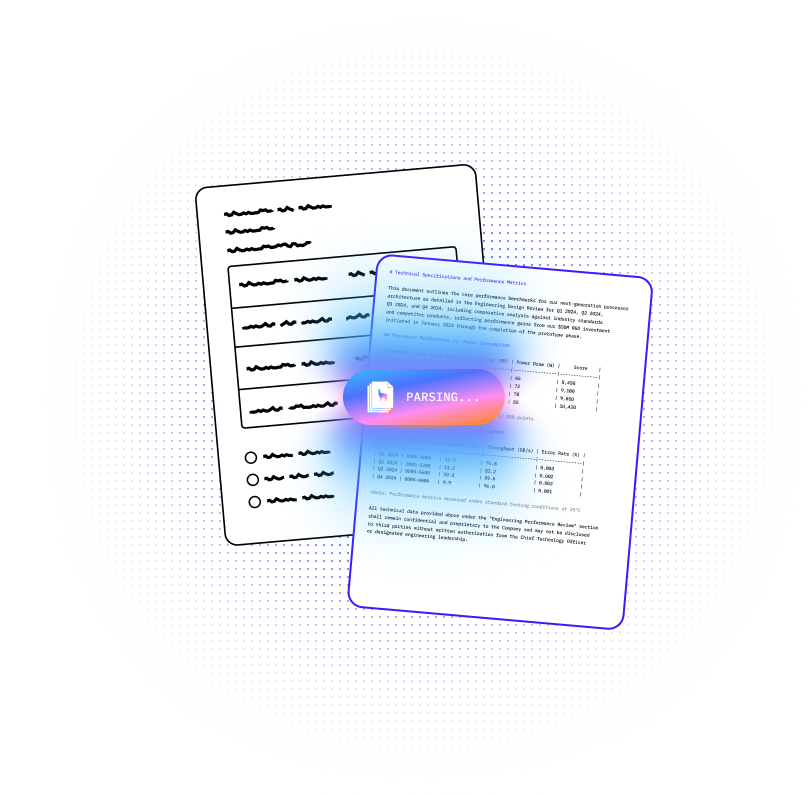
LlamaParse turns messy charts in PDFs and scans into structured, consistent JSON your pipelines can trust, even when layouts change. Agentic parsing uses layout-aware vision, validation loops, and citations so you can scale extraction with confidence and minimal manual cleanup.
Best-in-Class Accuracy

Parse pitch decks, CIMs, and board packs to extract chart and KPI data into structured JSON/Markdown, even when metrics are embedded in images or complex slide layouts. Build faster, more defensible diligence workflows with citations and confidence scores so teams can verify numbers without manually rekeying spreadsheets.

Convert figures and plots in study reports, publications, and regulatory PDFs into machine-readable tables, capturing units and axes context instead of losing meaning to text-only extraction. Standardize results across sites by automatically reconstructing charts into consistent outputs your analytics pipeline can ingest for meta-analysis and reporting.

Extract chart-based evidence from adjuster reports, engineering assessments, and loss runs—like damage severity graphs or trend charts—without brittle, layout-specific parsing code. Use agentic correction loops plus granular metadata to reduce exceptions and route only the hardest pages to higher-accuracy processing for predictable throughput and cost.

Turn customer-uploaded PDFs and slide decks into clean, structured chart data your product can query, powering dashboards and natural-language analytics without months of custom parsers. Use natural language parsing instructions to enforce your output schema from day one, so you ship integrations faster and avoid breaking when document templates change.
The Solution
01
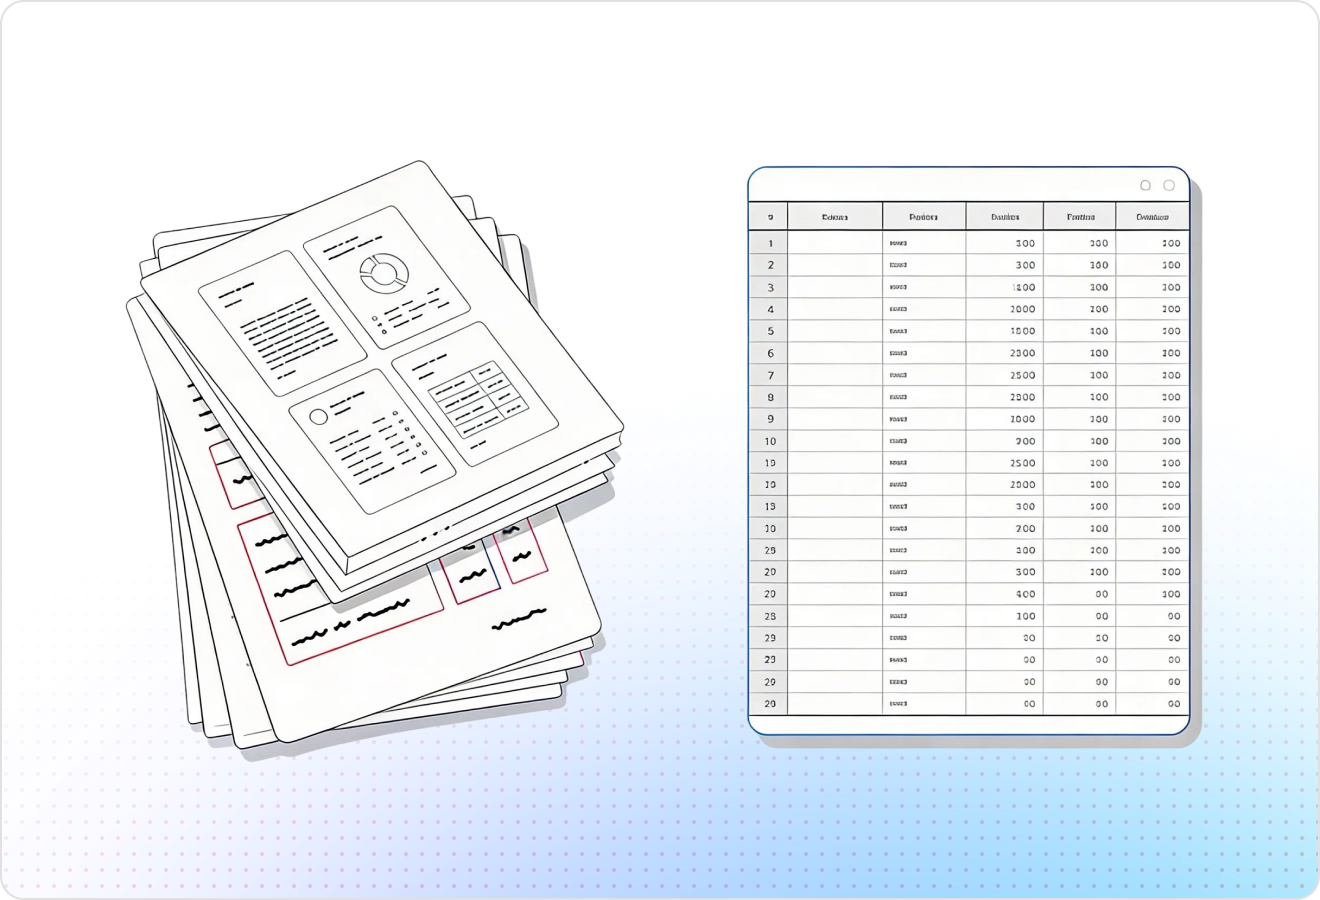
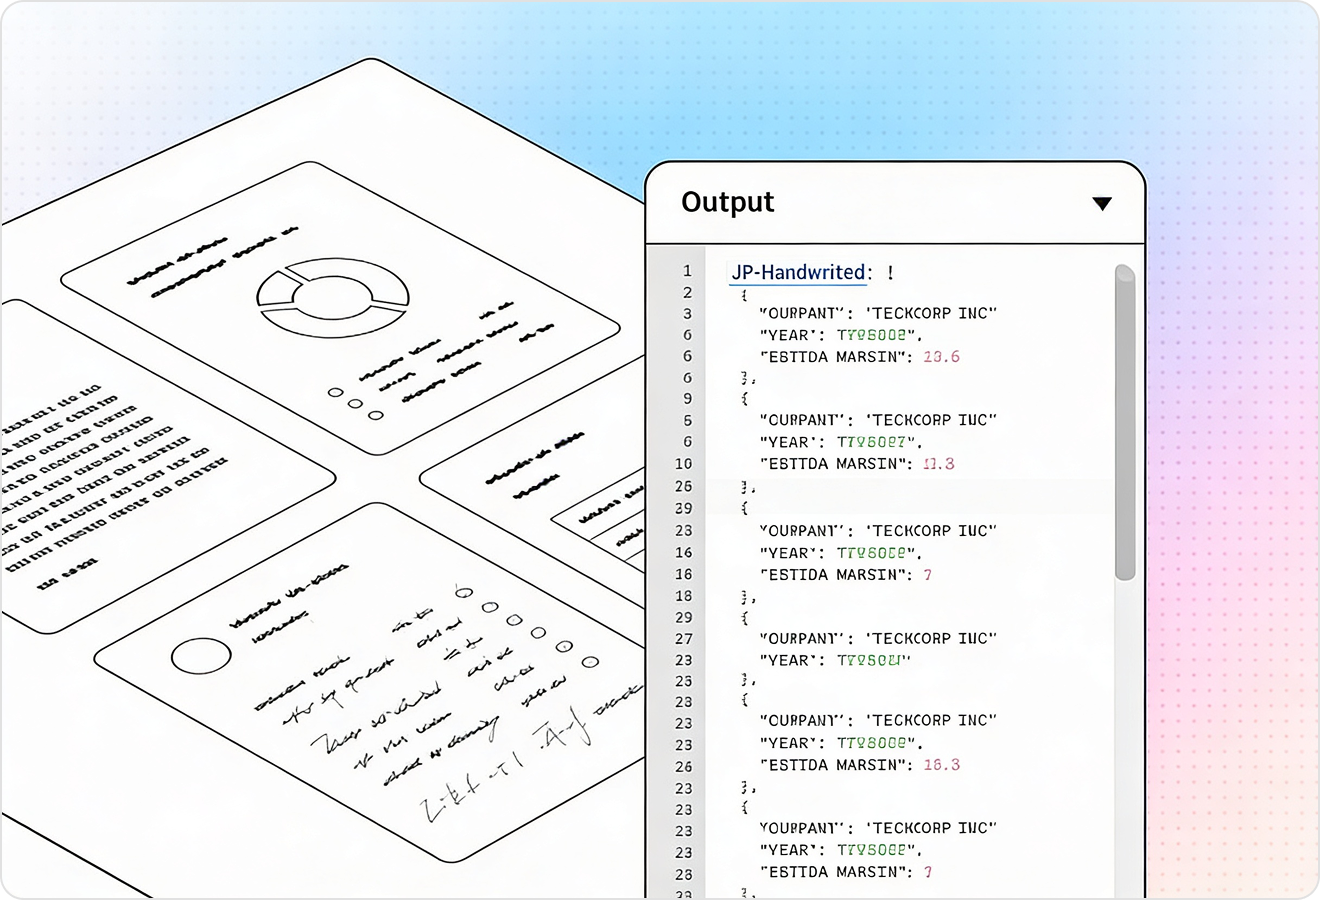
LlamaParse interprets charts and other visual figures using multimodal parsing, not just text extraction. You can turn plotted visuals into usable, machine-readable data so downstream analytics and agents can work with the actual numbers, not screenshots.
02
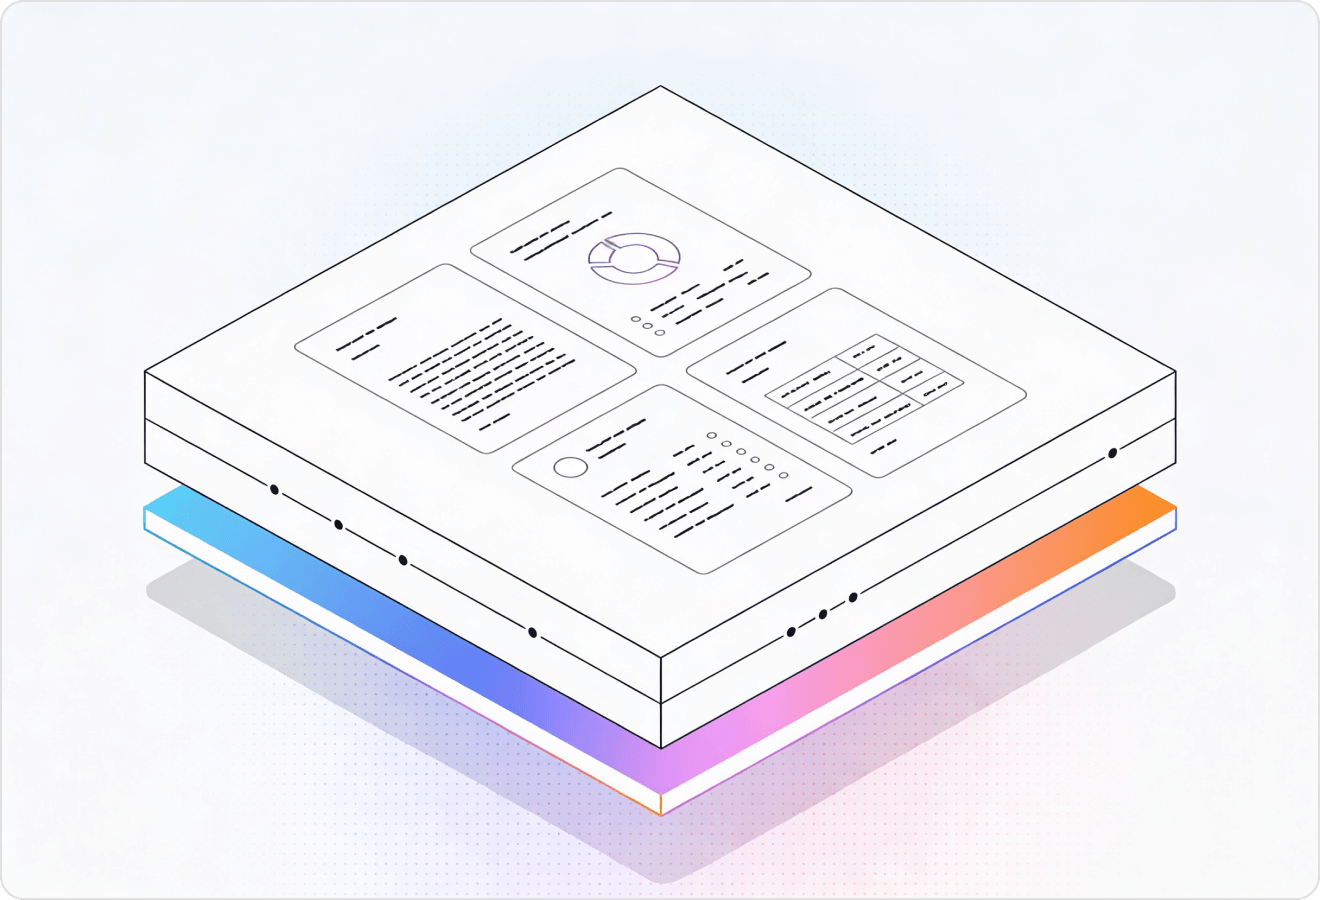
LlamaParse segments pages with layout-aware computer vision to keep titles, legends, axes labels, and surrounding narrative tied to the right chart. This prevents scrambled reading order and makes it easier to extract chart data with the correct units, time ranges, and series names.
03
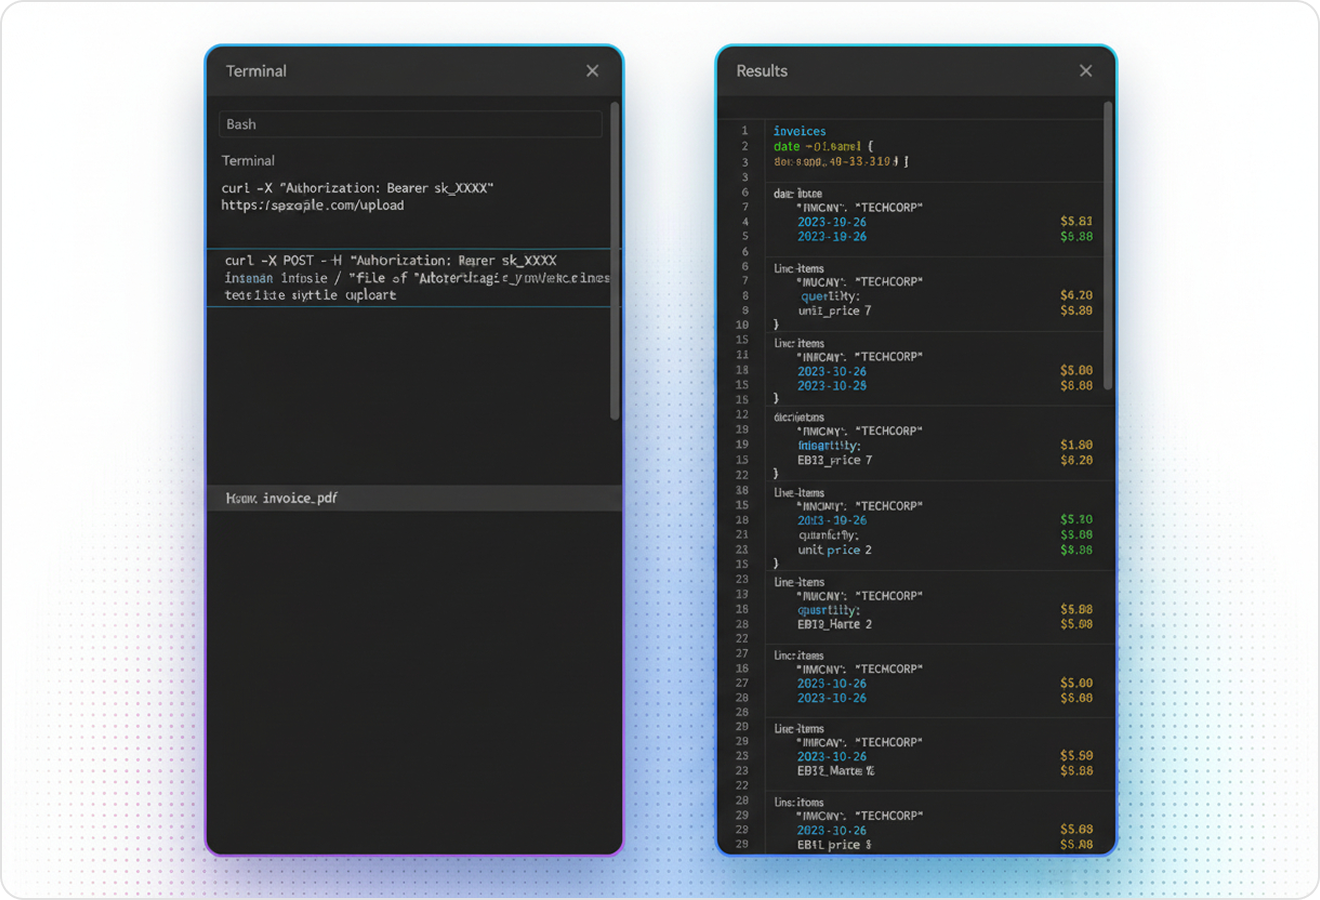
LlamaParse can emit structured JSON with element-level metadata like page references and coordinates for chart-related content. That makes chart data extraction auditable and straightforward to map into your own schema for BI pipelines, databases, or validation UIs.
04
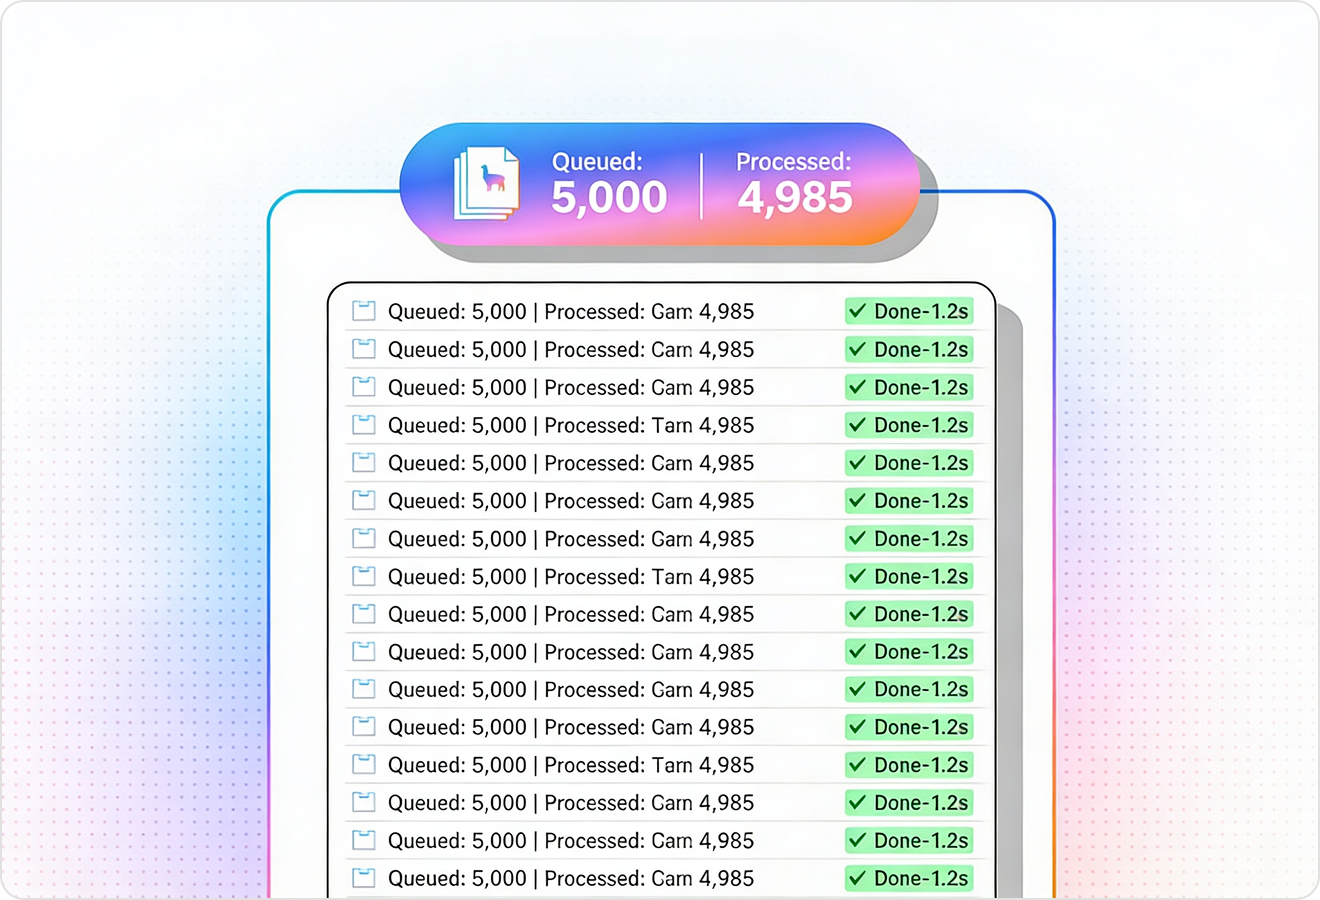
LlamaParse applies automatic validation loops to catch common extraction failures like swapped series, missing labels, or inconsistent totals. This reduces manual review and increases straight-through chart data extraction accuracy on messy, real-world PDFs and scans.
Technical OCR documentation
Explore our developer guides to easily connect your document pipelines to LlamaParse.
Explore the documentation
Our AI catches the typos that tired eyes miss.

Export to Excel, JSON, XML, or directly via API.

SOC2 Type II compliant with end-to-end encryption.

Train the tool on your specific forms in minutes, not days.

Average processing time of <3 seconds per page.
LlamaParse’s support of a wide variety of filetypes and its accuracy of parsing made it the best tool we tested in our evaluations. The LlamaIndex team was very responsive and we were off to the races within a day.
Common FAQs
01
It uses multimodal chart understanding to interpret the visual plot itself—bars, lines, points, axes, and scales—so you get machine-readable data instead of a screenshot. That means downstream analytics can work with the actual values and series, even when the source is a PDF report.
02
Yes. Layout-aware data capture preserves reading order and associates titles, legends, axis labels, and nearby narrative with the corresponding chart. This reduces mix-ups like wrong units, incorrect time ranges, or series names drifting between figures.
03
You can enable a structured JSON output mode that includes element-level metadata such as page references and coordinates. This makes the extraction easy to map into your schema, and simple to audit or reconcile in validation tools.
04
How do you handle messy PDFs and scans where chart extraction typically fails?
Automatic validation and correction loops catch common issues like swapped series, missing labels, or totals that don’t add up. This significantly reduces manual review time and improves straight-through accuracy on real-world documents.
05
How can I verify the extracted chart data is trustworthy for compliance or audit use cases?
Each extracted element can include traceable metadata (like where it came from on the page), so reviewers can quickly confirm values against the source. This provides transparency without slowing down your workflow with manual, row-by-row checks.
06
What’s the fastest way to get started and prove it works on my documents?
Start by running a small batch of your toughest PDFs to benchmark accuracy and identify any edge cases. With structured JSON and validation feedback, you can iterate quickly and move from pilot to production without rebuilding your downstream systems.