
PDFs don't store text the way you'd expect. As we’ve covered in the past, PDFs only store the content and where to draw it, without any concern about reading order. When you extract text from a PDF, you get something like:
html
{ text: "Revenue", x: 50.25, y: 100.5, width: 48.2, height: 12.0 }
{ text: "$1,234",  x: 350.8, y: 100.5, width: 38.5, height: 12.0 }
{ text: "Q1",      x: 50.25, y: 115.3, width: 12.1, height: 12.0 }
{ text: "$567",    x: 355.2, y: 115.3, width: 25.3, height: 12.0 }
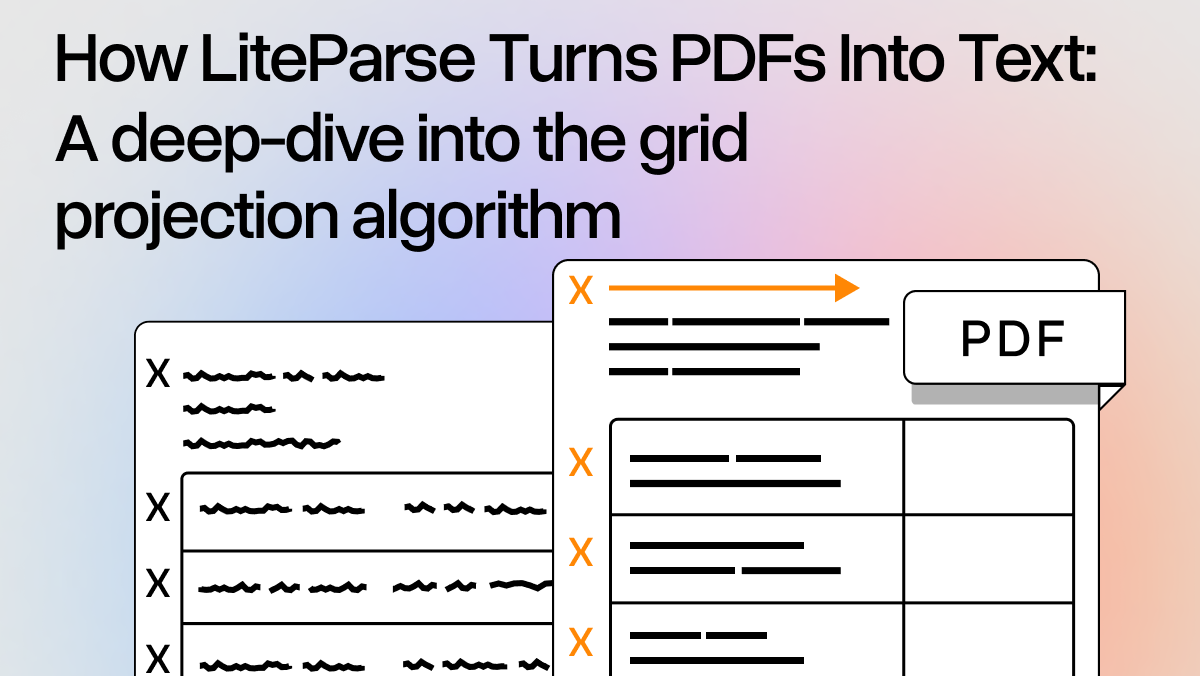
Taking this type of data and using it to reconstruct the document's visual layout from these coordinates alone is the core challenge when reading PDFs. This is what LiteParse's grid projection algorithm does, and it's the most interesting part of the codebase.
In this blog, we will walk through why we chose the approach we did for LiteParse’s core parsing algorithm, and dive into how it works at each step.
The Problem Space
Most PDF text extraction tools take one of two approaches:
- Concatenate everything -- join text items left-to-right, top-to-bottom, inserting spaces based on gaps. Simple, but destroys column structure, merges table cells, and loses alignment information. PyPDF is a common example of this type of output.
- Full layout analysis -- use ML models or heuristics to detect tables, columns, headers, etc. Accurate, but slow and complex. Markitdown and Docling are two examples of tools that take this approach.
LiteParse instead will project text onto a monospace character grid. Rather than trying to understand what the layout is (table vs. column vs. paragraph), it reconstructs where text appears spatially, preserving structure through alignment.
Step 1: From Coordinates to Lines
The first step is grouping text fragments into lines. PDF text items that share a similar Y coordinate belong on the same line, but "similar" needs some tolerance -- subscripts, superscripts, and floating-point imprecision mean items on the same visual line can differ by several points.
LiteParse calculates a Y_SORT_TOLERANCE based on the median text height:
html
tolerance = max(medianHeight * 0.5, 5.0)Items within this tolerance get grouped together and sorted left-to-right. Vertical gaps between lines also get measured here. When a gap larger than the typical line spacing appears, a blank line should be inserted in the output.
Step 2: Anchor Extraction
While processing text coordinates, LiteParse identifies alignment anchors, which are X coordinates where multiple text items consistently align.
Think about how you'd lay out a document in a word processor. There are a lot of important X positions that give the text meaning, like tabs, indents, and columns. These recurring X positions are the anchors.
LiteParse extracts three types with a set of heuristics and then normalizes them:
- Left anchors: Where text left-edges align (column starts, paragraph margins)
- Right anchors: Where text right-edges align (right-aligned numbers, justified columns)
- Center anchors: Where text centers align (centered titles, headers)
html
function roundAnchor(anchor: number): number {
  return Math.round(anchor * 4) / 4;
}
Anchor positions are rounded to the nearest quarter-unit. This helps to tolerate the slight positional variations common in PDFs. If two items have left edges at 50.12 and 50.38 , they both round to 50.25 and get grouped under the same anchor.
After extraction, anchors go through cleanup:
- Delta filtering removes isolated anchors with no nearby vertical support (items that happen to share an X position by coincidence)
- Intercept filtering removes anchors that would split content that should stay together
Step 3: Snap Classification
Each text item gets classified by which anchor it belongs to:
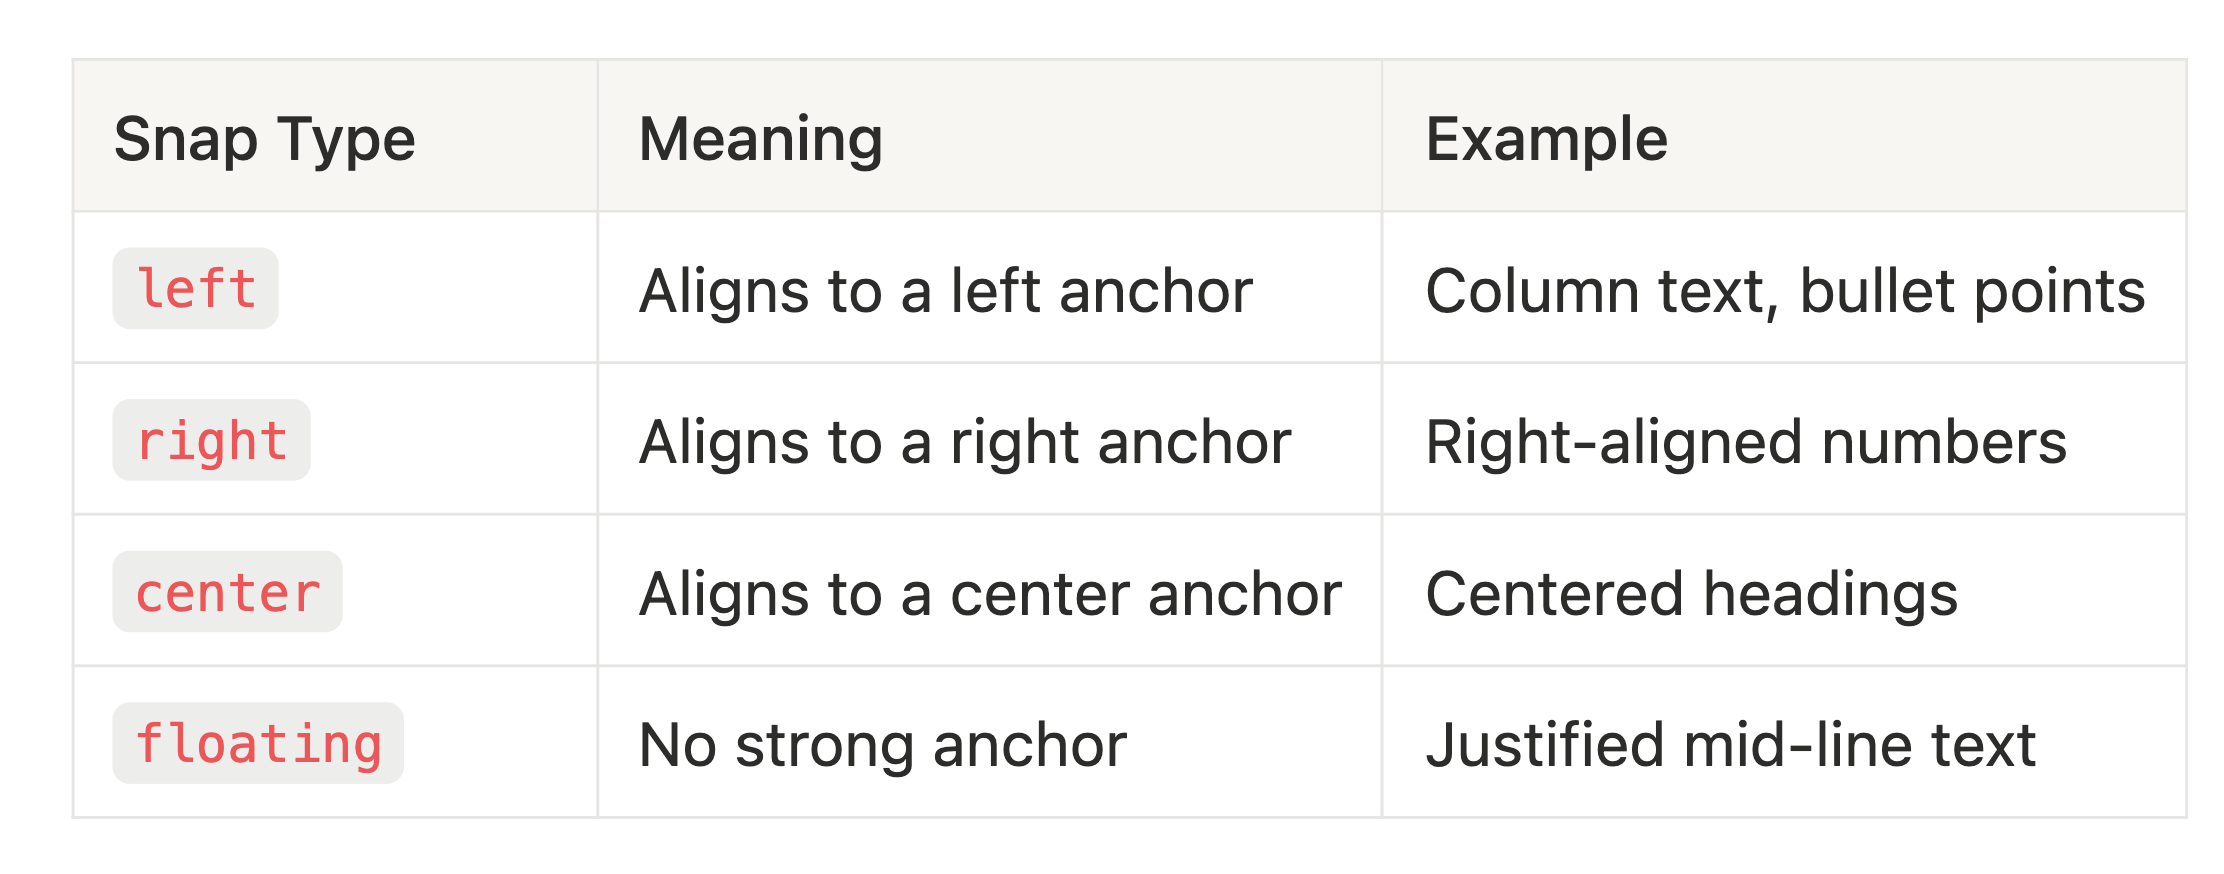
When an item matches multiple anchors (e.g., both left and right), LiteParse resolves the conflict by picking the anchor shared by the most items. Ties break in priority order: left > right > center.
Step 4: The Flowing Text Escape Hatch
Before grid projection runs, LiteParse checks whether a block of text is actually just a flowing paragraph. Grid projection is designed for structured content (tables, multi-column layouts, aligned data), and applying it to paragraphs can produce artifacts -- extra whitespace, word fusion, or broken line wrapping.
The detection is a simple heuristic: if a block has few anchors (<=4 total) and most lines span more than half the page width, it's flowing text. These blocks get rendered with simple space-based joining instead of grid projection.
There's also a per-line version of this check for mixed blocks where some lines are paragraph text within an otherwise structured region.
Step 5: Grid Projection
Now the core of the algorithm. Each text item needs a grid column -- a character position in a monospace output line. The conversion from PDF coordinates to grid position is:
html
gridColumn = round(pdfX / medianCharWidth) Where medianCharWidth is the median width of all text items on the page (a proxy for the "typical character width" in PDF points).
But this naive conversion alone would produce bad results. Items need to respect minimum spacing, avoid overlapping each other, and maintain consistent column alignment across lines. This is where the rendering order and forward anchors come in.
Rendering Order
Items are rendered in a specific priority order within each line:
- Floating items first (unanchored text)
- Left-snapped items
- Right-snapped items
- Center-snapped items
This order matters because each rendered item constrains where subsequent items can go. Floating text gets placed first based on raw coordinates, then anchored items snap into position around it.
Forward Anchors
When a snapped item renders at grid column N , that position becomes a forward anchor. This is a constraint that propagates downward through the page.
Consider a two-column table:
html
Name         Score      <-- "Name" is left-snapped, renders at column 0
                            "Score" is left-snapped, renders at column 13
Alice        95         <-- "Alice" has same left anchor as "Name"
                            Forward anchor says: column 0
                            "95" might be floating, but forward anchor
                            from "Score" constrains it to column 13
Without forward anchors, "95" might render anywhere between "Alice" and the end of the line based on its raw PDF X coordinate. With them, it snaps to column 13, maintaining the table structure.
Forward anchors are tracked separately for each snap type (left, right, center, floating) and can optionally persist across page boundaries for documents like multi-page tables.
The Rendering Decision Chain
For each text item, the final grid position is determined by taking the maximum of several constraints:
- Target position:
round(pdfX / medianWidth)-- where the item "wants" to be - Line maximum: position after the previous item on this line + minimum spacing
- Forward anchor: the column established by an item above with the same anchor
The binding constraint (whichever produces the largest value) determines where the item actually lands. This ensures items never overlap, always maintain minimum spacing, and stay aligned with their column.
Step 6: Post-Processing
After projection, the raw grid output goes through cleanup:
- Sparse block compression: Blocks where >80% of characters are whitespace get their spacing compressed (4-space column gaps become 2-space gaps). This helps preserve tokens for LLMs while still maintaining layout information.
- Margin removal: Consistent left/right/top/bottom whitespace margins are stripped
- Text cleanup: Null characters removed, trailing whitespace trimmed
The result is a plain text representation that preserves the document's spatial structure in a readable format.
Debugging the Algorithm
One of the hardest parts of building a spatial text algorithm is understanding why a specific item ended up where it did. A misplaced column or merged table cell could be caused by any stage of the pipeline: a bad anchor, a wrong snap classification, a forward anchor from three lines up.
We built a debug system within LiteParse (GridDebugLogger ) that traces every decision in the pipeline. You can enable it with filters to narrow down exactly what you're investigating:
html
const result = await parser.parse("document.pdf", {
  debug: {
    enabled: true,
    textFilter: ["Revenue"],   // only trace items containing "Revenue"
    trace: true,               // log the full decision chain per item
  }
});
In trace mode, each rendered item logs its complete decision chain:
html
[render] line=5 box=2 "Revenue" snap=left
  targetX: 10 (pdfX=50.25, medianWidth=5.2)
  lineMax: 0 (prev item ends at col 0)
  forwardAnchor: 10 (from "Name" on line 0)
  binding: targetX (10)
  finalCol: 10
Visual Debugging
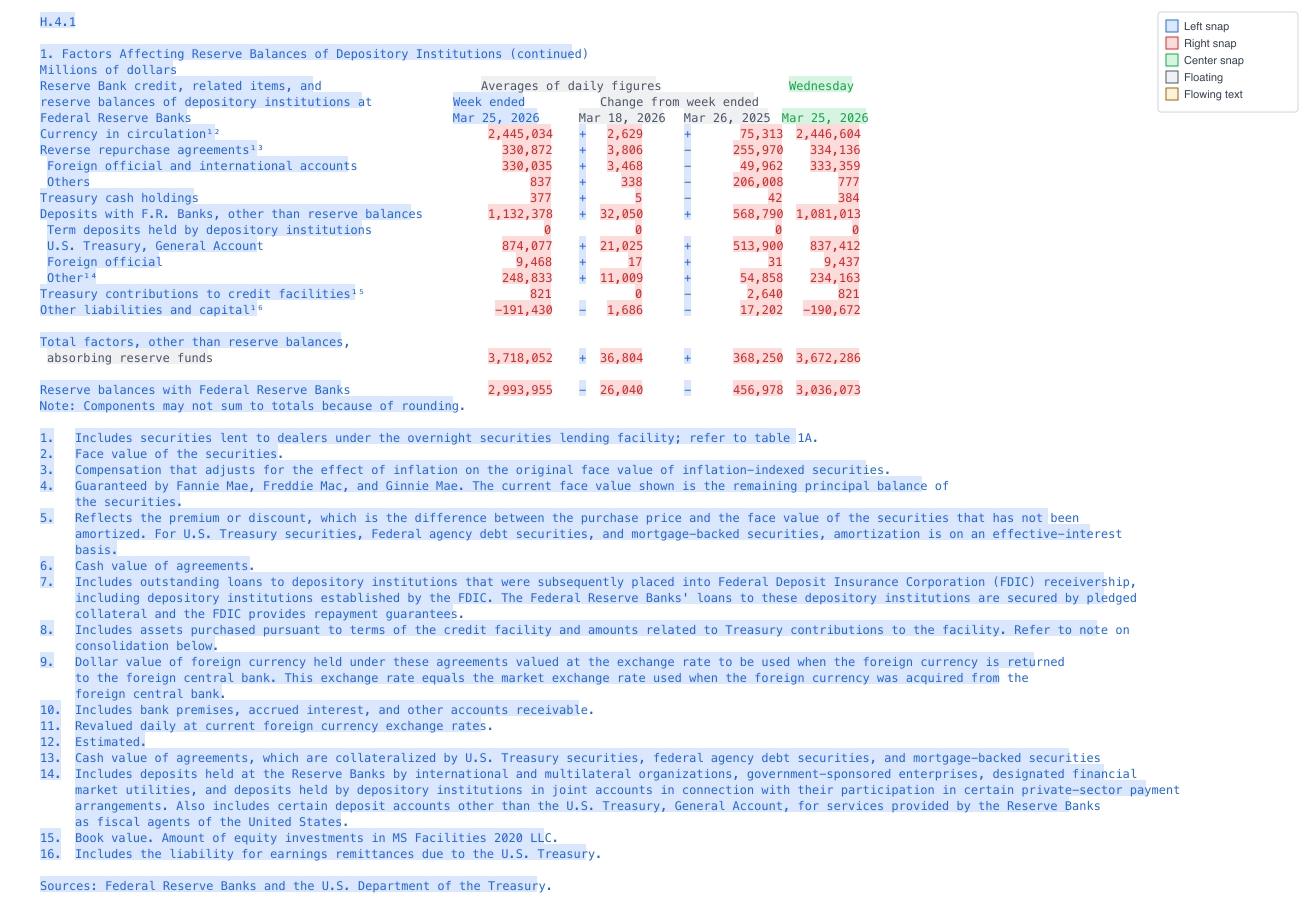
The debug system can also generate PNG visualizations of the grid output, color-coded by snap type:
- Blue: Left-snapped
- Red: Right-snapped
- Green: Center-snapped
- Gray: Floating
- Yellow: Flowing text
html
lit parse doc.pdf --debug '{"enabled":true,"visualize":true,"visualizePath":"./debug"}' This produces a page-N-grid.png for each page -- a monospace rendering of the projected output where you can visually compare the grid against the original PDF to spot alignment issues.
When combining the visual debugging with the generated trace, we’ve found that coding agents like Claude are exceptional at debugging the algorithm and designing improvements.
Wrapping Up
The grid projection algorithm is roughly 1,650 lines of TypeScript. It’s not exactly trivial, but compact for what it does. The core ideas are:
- Extract alignment anchors from recurring X positions
- Classify items by which anchor they belong to
- Project items onto a character grid, propagating column positions forward
- Fall back to simple joining for paragraph text
The debug tooling makes the algorithm's decisions not only transparent and auditable, but lets agents sit in the driver’s seat to drive improvements to the overall algorithim.
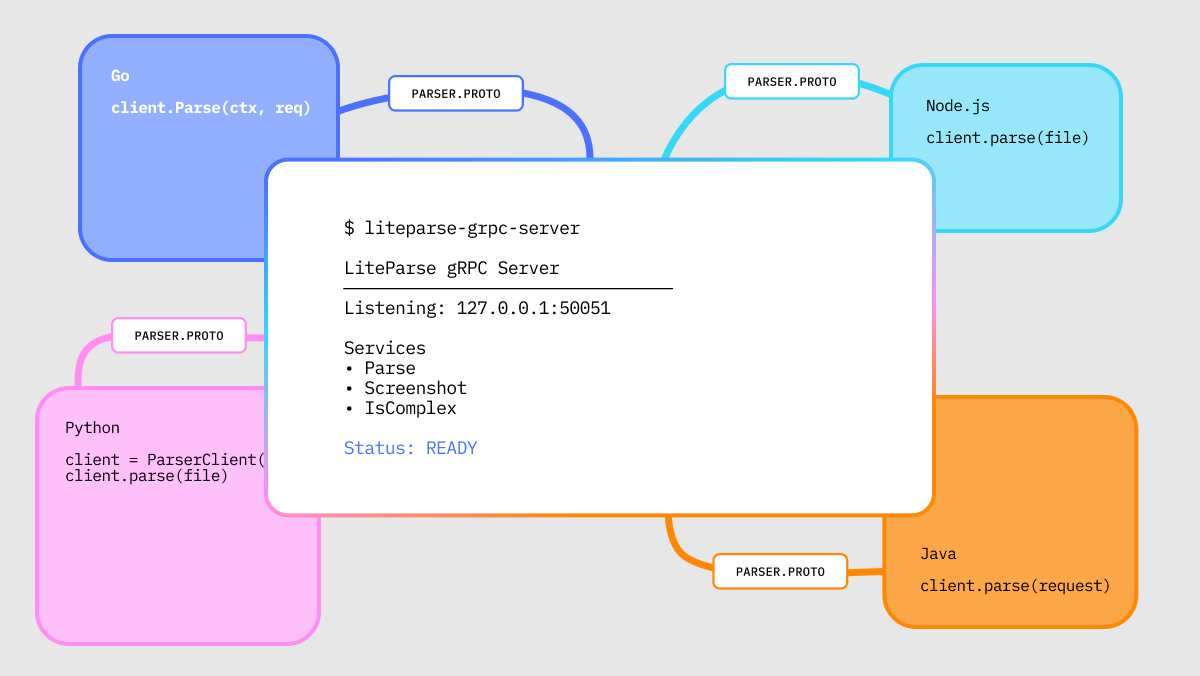
LiteParse is open source at github.com/run-llama/liteparse. Try it on your own documents and let us know how it works!