

For decades, OCR systems have combined heuristics and specialized models for text recognition, layout analysis, and table extraction. VLMs have substantially advanced these capabilities, allowing a single model to transcribe text, reconstruct tables, interpret charts, and extract form fields in one pass.
The long tail of dense tables, unlabeled charts, handwriting, and complex forms remains massive. Each parsing dimension requires its own representation and definition of correctness: transcription and reading order for text, values associated with row and column headers for tables, numerical series for charts, and field-value associations, checkbox states, and blank fields for forms. A benchmark needs to measure these capabilities separately and account for the consequences of errors within each one.
Similarity to a reference does not necessarily capture those consequences. A wrong financial total may barely affect a text similarity score, while an equivalent table in a different format receives a large penalty. More data or more metrics alone cannot resolve this mismatch.
Alignment with human preferences should be an explicit objective of metric design. Existing similarity measures, property tests, and model judgments encode preferences through their scoring rules or prompts. With ParseBench-2, we make the expected response to specific error types an explicit target: we define severity policies, construct scenarios that test them, and optimize deterministic metrics against those targets. This gives us a way to improve alignment while retaining granular, repeatable evaluation that users can adapt to their workloads.
Design criteria for a document parsing benchmark
We evaluate benchmark design along six criteria:
1. Representative data. Enterprise knowledge work depends on financial statements, insurance filings, contracts, and government forms. Benchmarks should reflect these workloads, including their nested tables, scanned pages, handwriting, and unusual layouts. Sampling also determines what a score means: a collection of difficult cases measures robustness to those cases, while a representative production sample estimates performance on a particular workload.
2. Granularity. Separate metrics for text, formatting, tables, charts, forms, and visual grounding let us isolate failures and compare parsers with different strengths. Within each dimension, error types also matter. A wrong cell value, a correct value attached to the wrong header, and an equivalent representation should not automatically receive the same penalty.
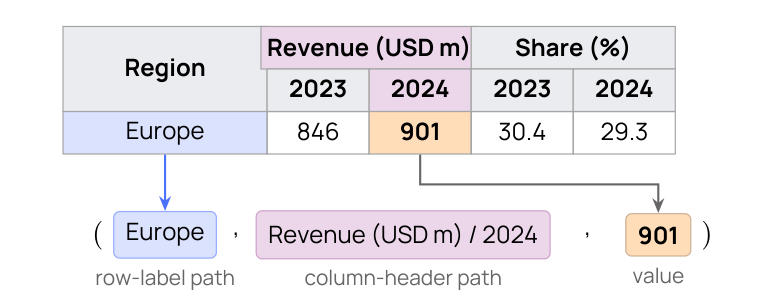
Representing a table value together with its row and column headers distinguishes a transcription error from an association error. Here, 901 represents revenue for Europe in 2024. ParseBench-2 report, Figure 8.
Granularity enables customization, but increasingly detailed checks introduce complexity. Their aggregation still needs to agree with a holistic assessment of the output; passing many local checks does not guarantee suitability for downstream use.
3. Quantifiability. Controlled changes to a correct output should produce measurable score changes that reflect their severity. This lets us compare metrics and detect scoring regressions. Assigning severity involves judgment; quantification makes its implementation testable.
4. Repeatability. Fixed outputs, annotations, and scoring configurations should produce the same results. Reproduction requires versioned data and code. The benchmark should distinguish variation from rerunning the parser from variation introduced by the evaluator.
5. Controllability. Users should be able to select document subsets, reweight dimensions, and adjust error penalties for their application without implementing an evaluation framework from scratch.
6. Alignment with human judgment. Scores should reflect the consequences of errors and the acceptability of alternative representations. A deterministic metric can consistently reward the wrong output, so repeatability alone does not establish alignment. This requires validation against independent human judgments beyond the scenarios used to develop the metric.
Existing benchmarks and the limitations of their metrics
OmniDocBench provides detailed annotations for text, tables, formulas, layout, and reading order across multiple document types. olmOCR-bench tests properties such as content presence, block ordering, and relationships between table cells. These checks address limitations of edit distance, which can penalize equivalent representations while barely reacting to a consequential one-character error.
ParseBench-1 expanded enterprise coverage across five parsing dimensions, but its metrics still exhibited substantial mismatches with human judgments of error severity.
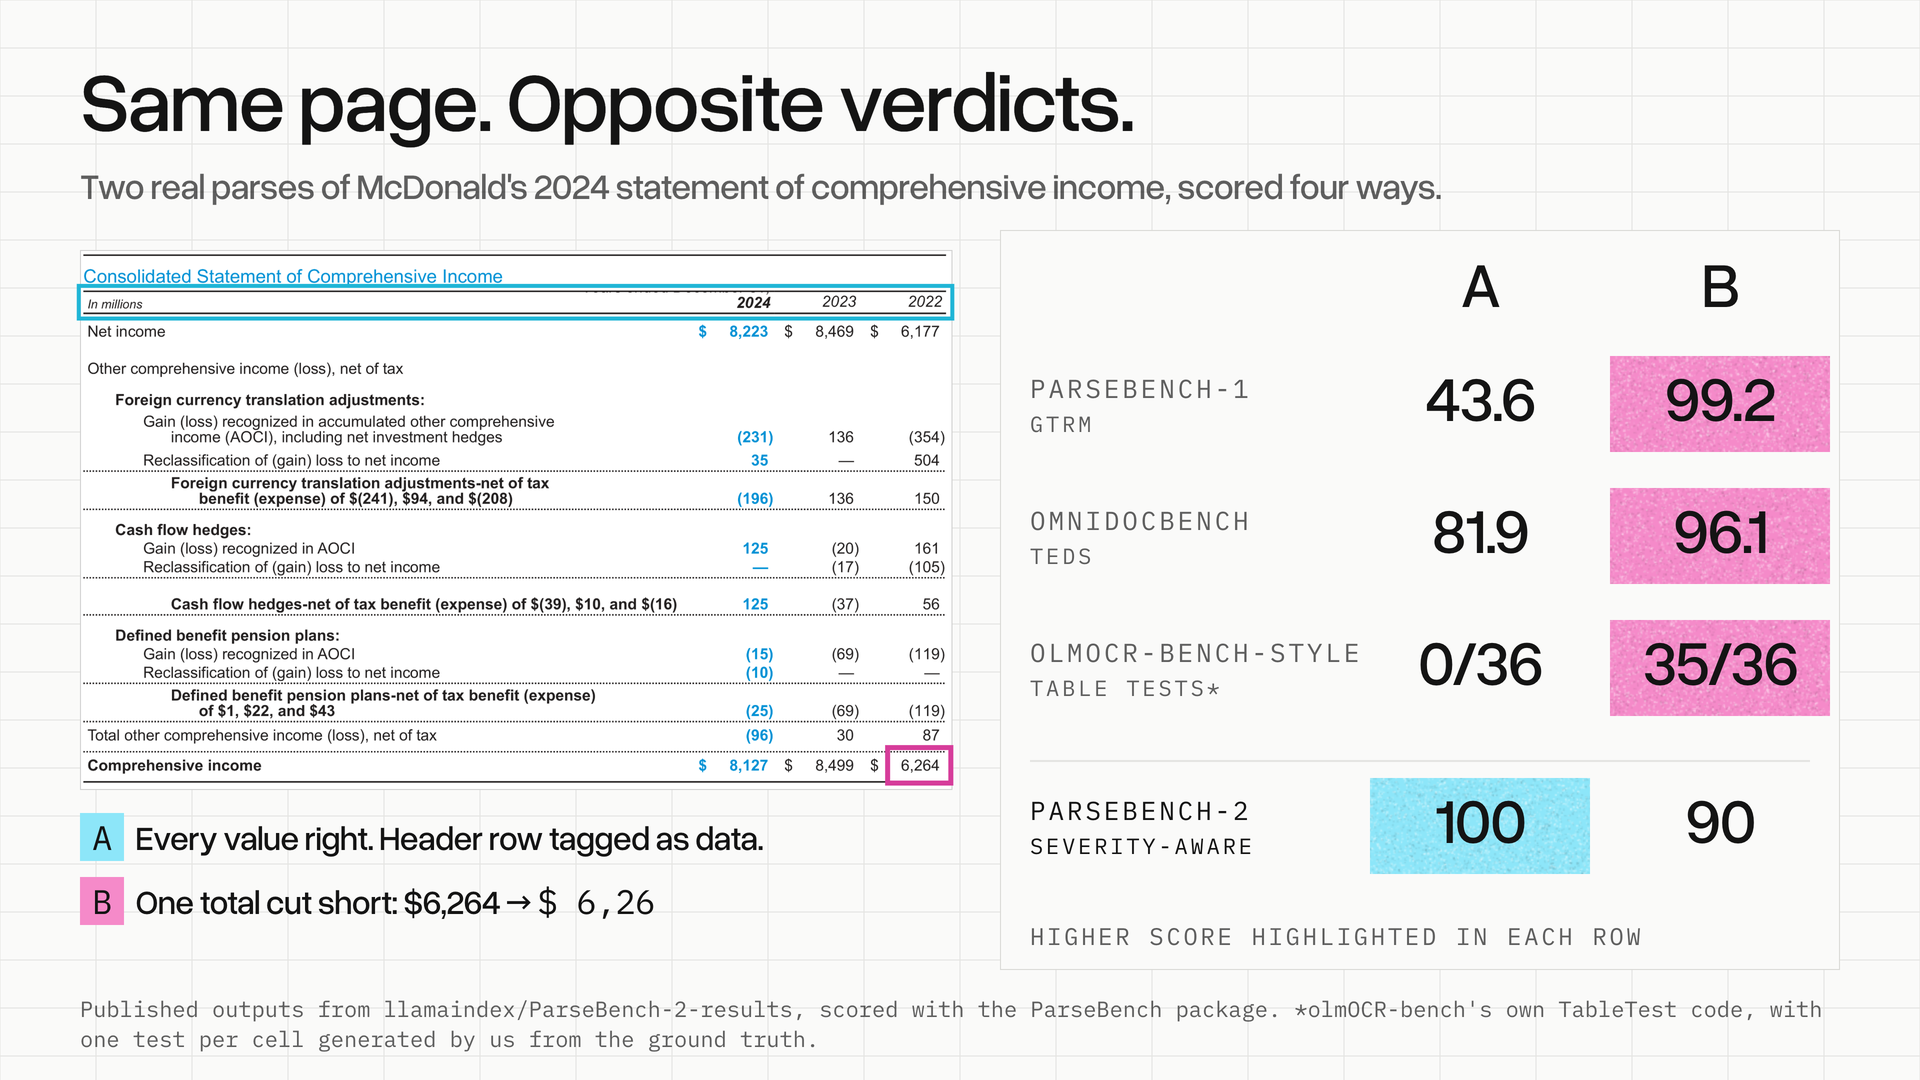
Two published parser outputs on the same page, selected to illustrate a scoring disagreement. The olmOCR-style results use its TableTest implementation with tests we generated for every reference cell; they are not results on the original olmOCR-bench dataset. Outputs are available in the ParseBench-2 results.
In this McDonald’s statement, one output preserves the numbers and labels but uses ordinary HTML cells for headers and merged cells for section labels. Another truncates the 2022 comprehensive income value from $6,264 to $6,26. ParseBench-1 scores the corrupted output at 99.2 and the factually correct output at 43.6. TEDS, used by OmniDocBench, also ranks the corrupted output higher.
Similarity scores can dilute a consequential error across correctly recovered content, while structural comparisons can overpenalize equivalent representations. Property tests depend on coverage and aggregation: an untested value can be wrong, and an unweighted pass rate assigns equal importance to every check.
Explicit HTML semantics may matter to an application consuming table markup. For financial extraction, preserving values and their associations is the more relevant objective. A metric needs to implement these priorities consistently.
LLM-based evaluation and implicit preferences
LLM judges can recognize equivalent representations and detect errors that are difficult to encode in deterministic rules. Pairwise systems such as Reducto’s ParseArena use these judgments to compare parsers, but an overall preference leaves the tradeoffs between dimensions implicit. A win rate does not reveal how the judge weighs a formatting error against a wrong table value.
We tested Haiku 5.5 with the published PAIR prompt on 412 pages of SERFF insurance filings, comparing LiteParse’s plain-text output with r-1-mini. Each page received three judgments with presentation order varied. We inspected the 77 pages where LiteParse received the higher mean preference score, a subset selected after judging.
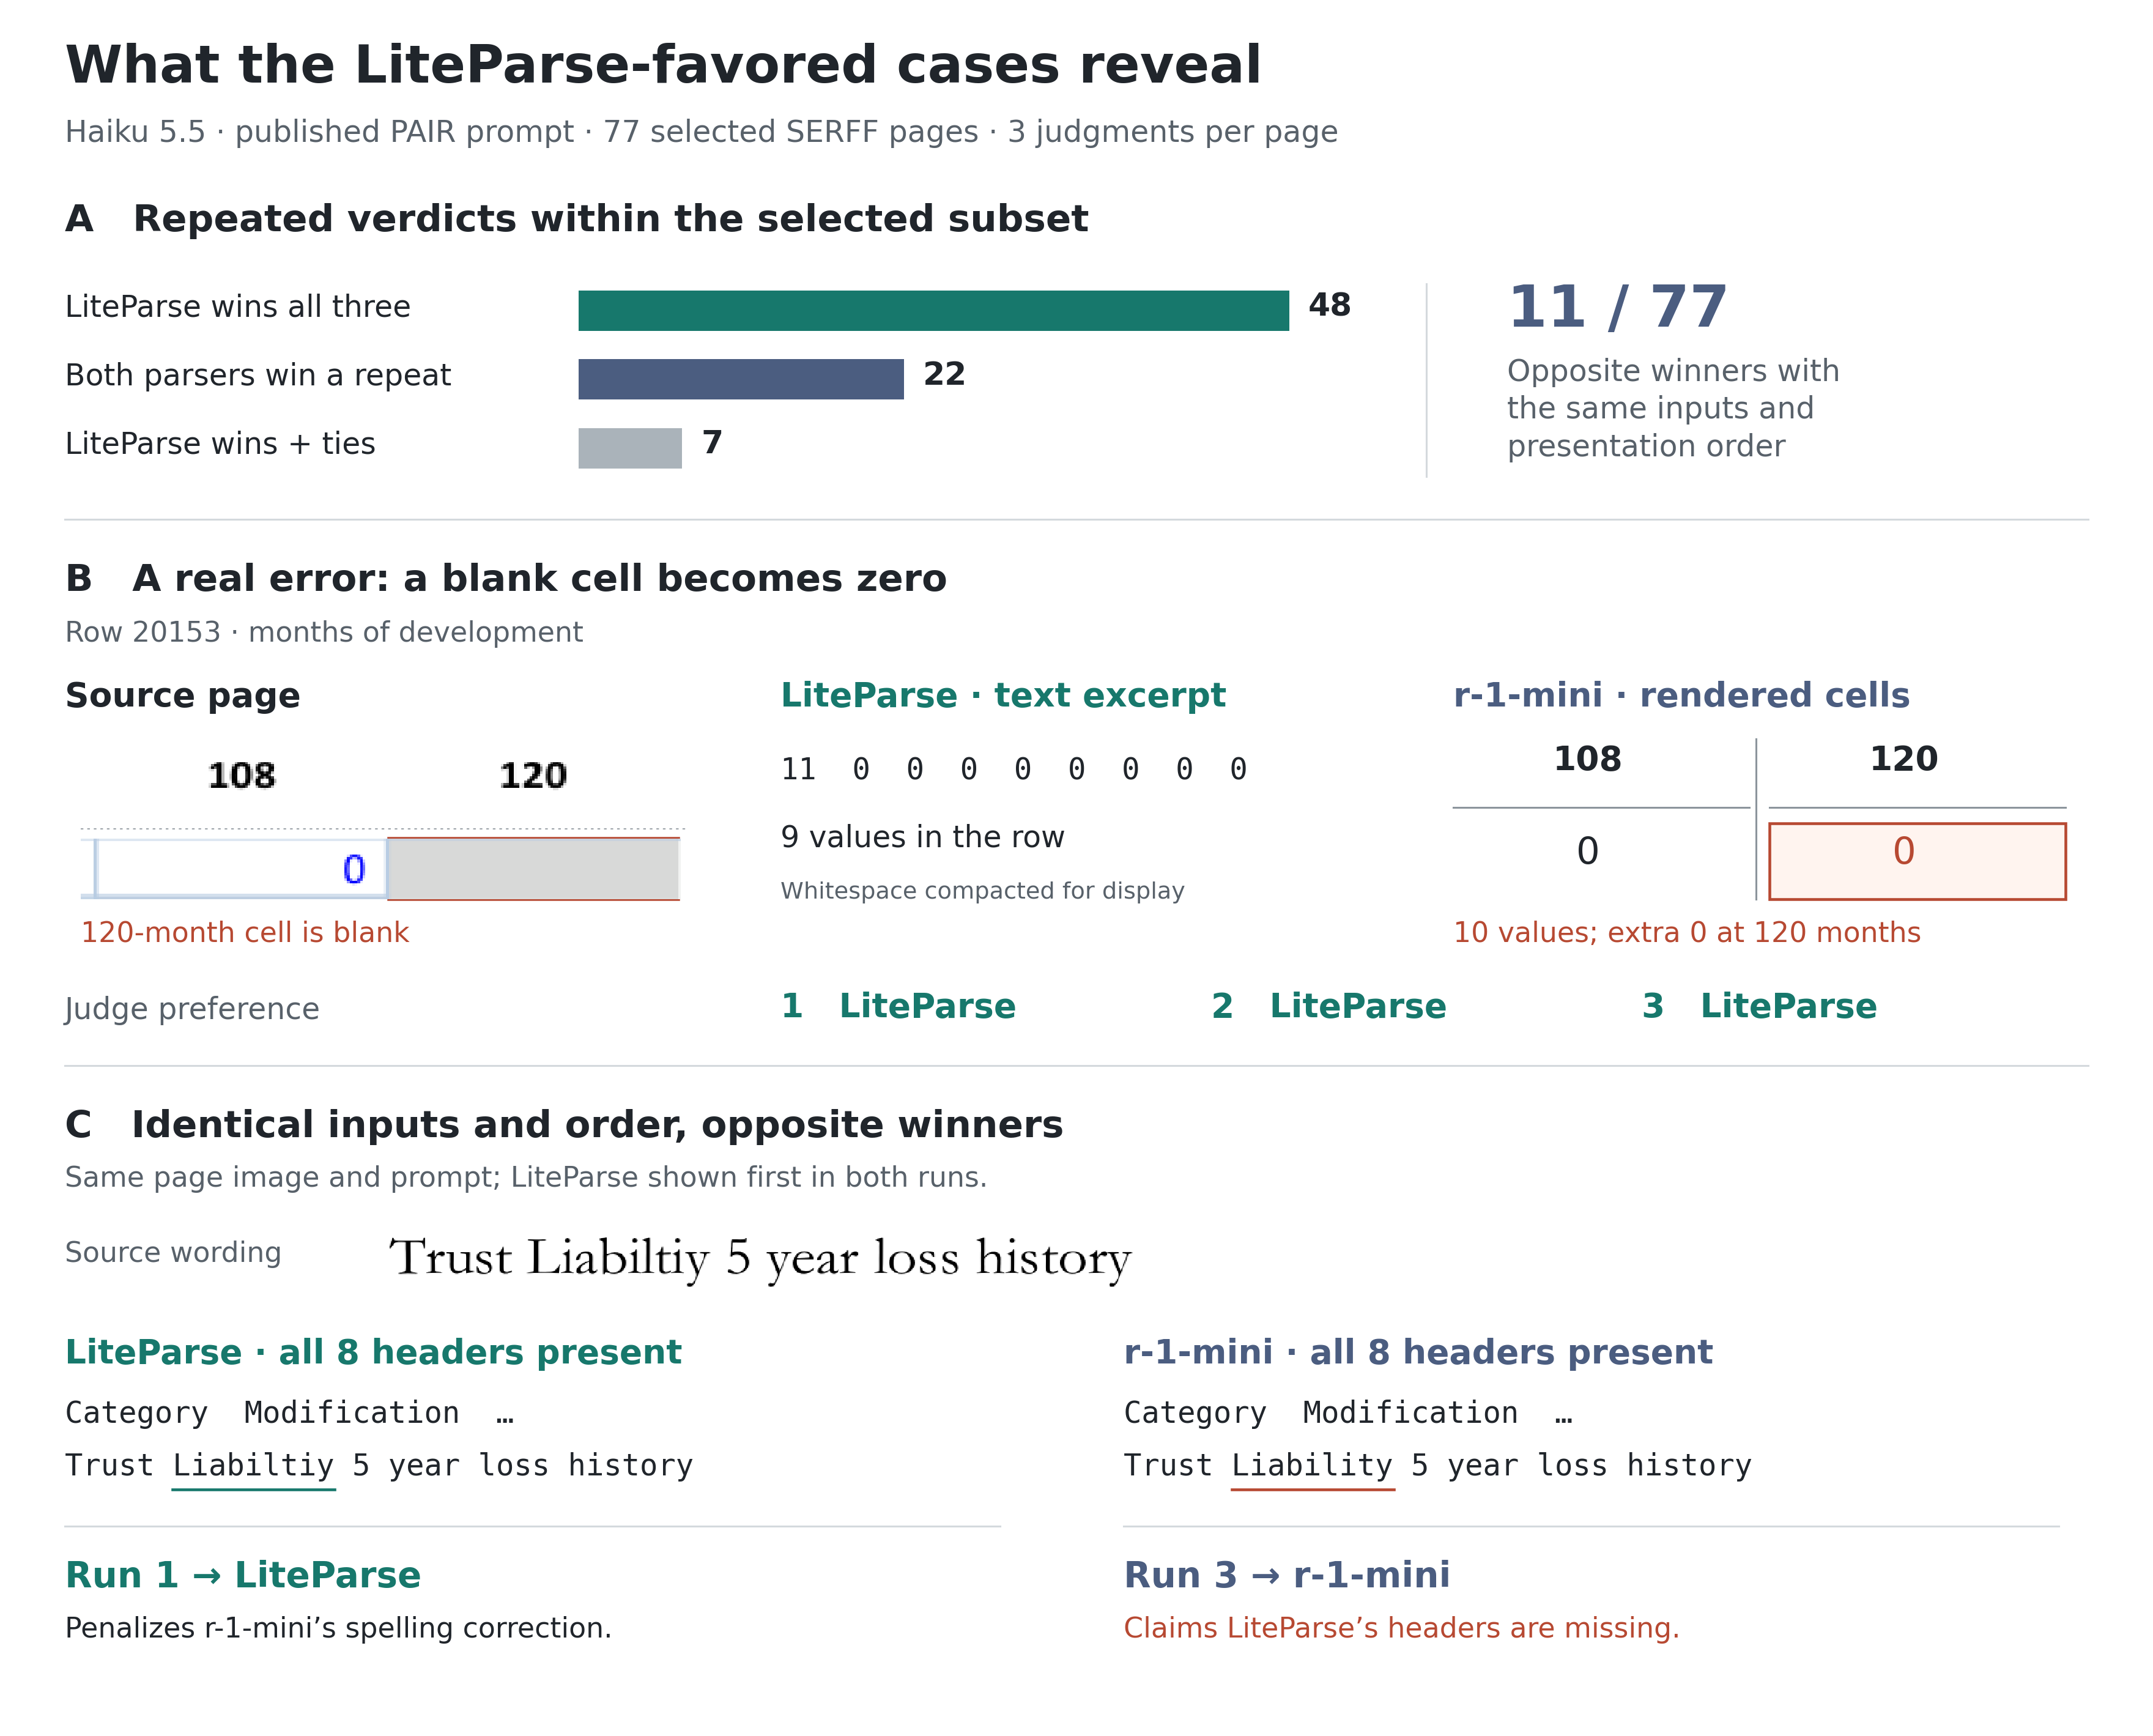
Three judgments per page on a subset selected for mean LiteParse preference above 0.5 (win = 1, tie = 0.5). The figure uses source crops and shortened output excerpts, with whitespace compacted for display. This evaluates our Haiku 5.5 setup, not ParseArena’s deployed judge.
Some LiteParse preferences identify real errors. In panel B, r-1-mini inserts a zero into a blank cell, while LiteParse preserves the source values. All three judgments prefer LiteParse. Our saved ParseBench-2 Tables score for r-1-mini was 98.1, so the judge also identified an error our metric underpenalized.
However, 11 pages in the selected subset reverse winners with the recorded prompt, page image, parser outputs, and presentation order unchanged. Panel C shows one such case: one run prefers LiteParse for preserving the source typo “Trust Liabiltiy,” which r-1-mini corrects. Another run prefers r-1-mini after claiming LiteParse omitted the header row, even though all eight headers are present. The judge changes both its error assessment and its preference without a change in the evidence.
A granular judge could report errors by dimension and apply an explicit severity rubric, as we began to specify in the Document Parsing Protocol. Such a system still needs to demonstrate consistent error detection and severity assignment at a cost that permits repeated evaluation.
ParseBench-2: optimizing metrics against a severity policy
ParseBench-2 separates desired scoring behavior from the metric implementation. A severity policy assigns perturbations to critical, major, minor, or benign categories, with target ranges for score changes. Changing a monetary amount from $4,200 to $4,700 should incur a substantial penalty even among hundreds of correct values; returning an equivalent supported table representation should leave the score unchanged.
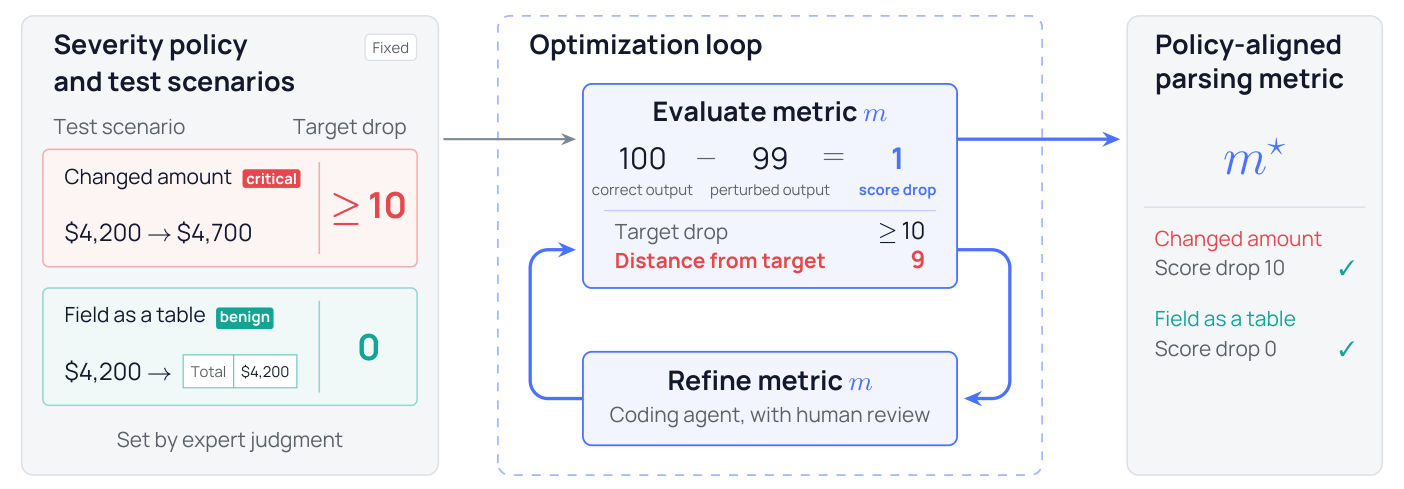
The severity policy and target score changes stay fixed while the metric implementation is refined. Report, Figure 2.
Our six test suites contain 330 perturbation types, covering errors and benign variations. We introduce controlled changes to correct outputs, measure deviations from the policy’s targets, and use coding agents to revise comparison rules, error detectors, and weights under human review. Regression checks across the suites guide this hillclimbing process. Humans specify the intended behavior and resolve ambiguities; agents help implement and test the interacting rules. The resulting scorer remains deterministic for fixed inputs and versions.
Severity caps prevent consequential errors from being diluted by correct content. For text, formatting, tables, charts, and forms, the page score is the minimum of the content-recovery score and the severity cap. A first detected critical error caps an otherwise perfect page at 90 under the default policy. Visual grounding uses separate rules without this cap.
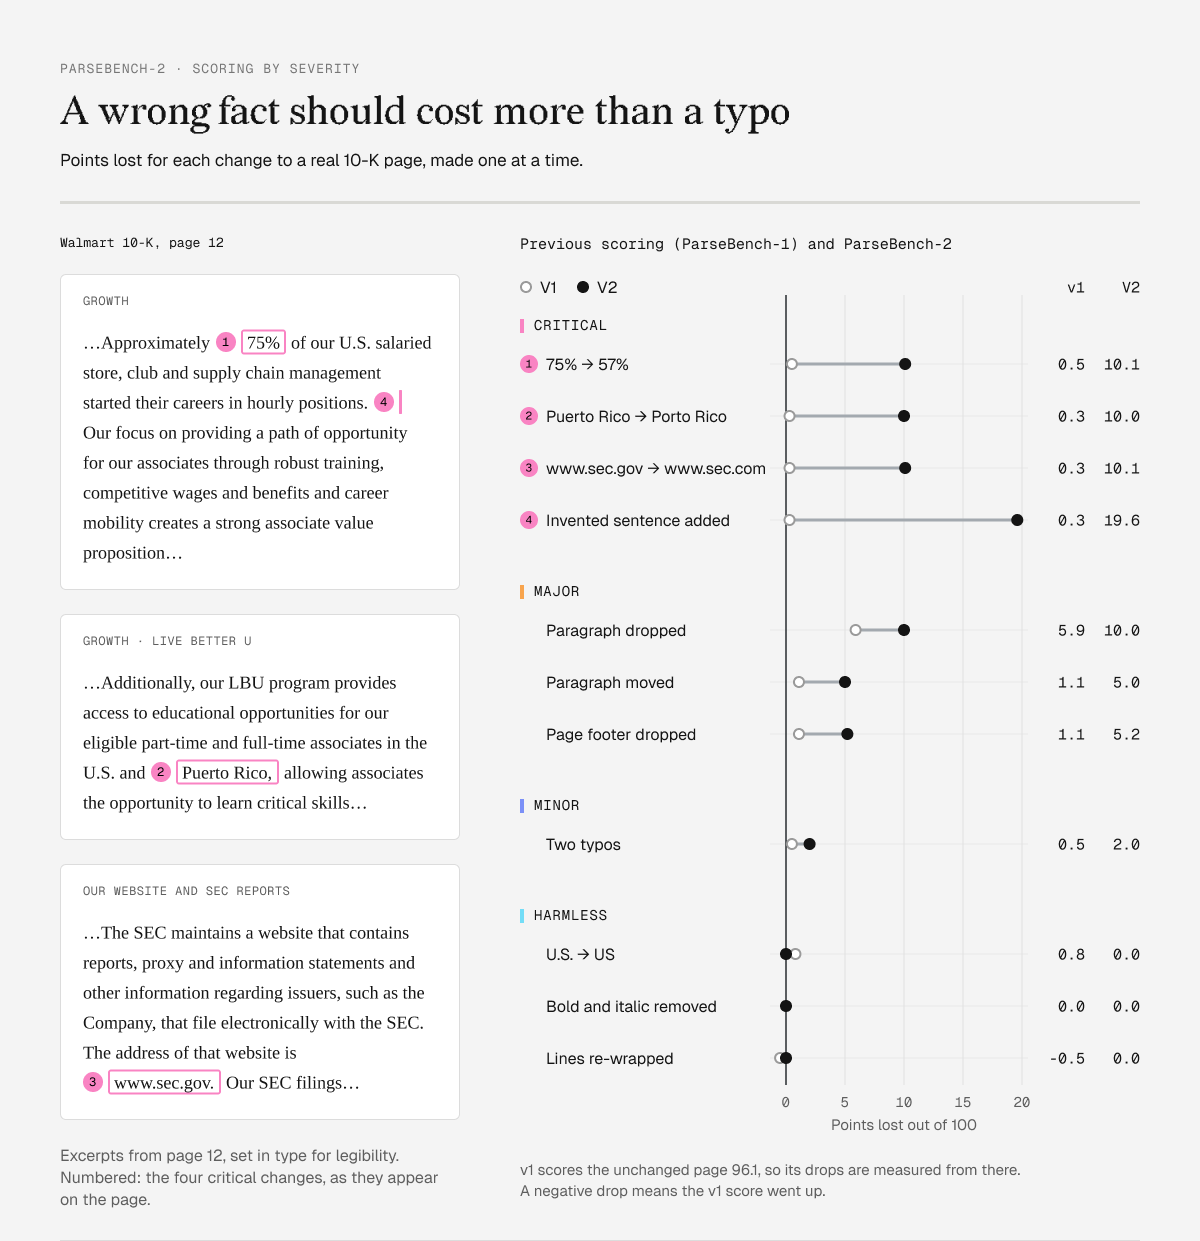
Controlled changes to a Walmart 10-K page, evaluated one at a time. These test the metric’s response to known changes; they are not observed parser error rates. Figure from the ParseBench-2 launch post.
ParseBench-2 also expands to 4,317 page-level cases across six dimensions, adding forms and targeted datasets for difficult tables and formatting. Complete reference tables replace selected-value checks for all 1,025 charts, enabling evaluation across each data series.
Agreement with the severity policy on development scenarios measures compliance with our stated preferences. It does not establish agreement with all users or generalization to unseen documents.
Customizing the metric for your workload
ParseBench-2 weights its six dimensions equally by default, though applications may prioritize them differently. Financial analysis depends heavily on correct table values and associations; a retrieval system may tolerate some formatting loss. The Metric Lab lets users examine how alternative policies affect saved results through three levels of customization:
- Dimension weights: adjust each capability’s contribution to the overall score.
- Severity weights: change how much critical, major, and minor errors reduce the severity cap.
- Error classifications: reassign supported error types to severity levels, or remove their contribution to the cap.
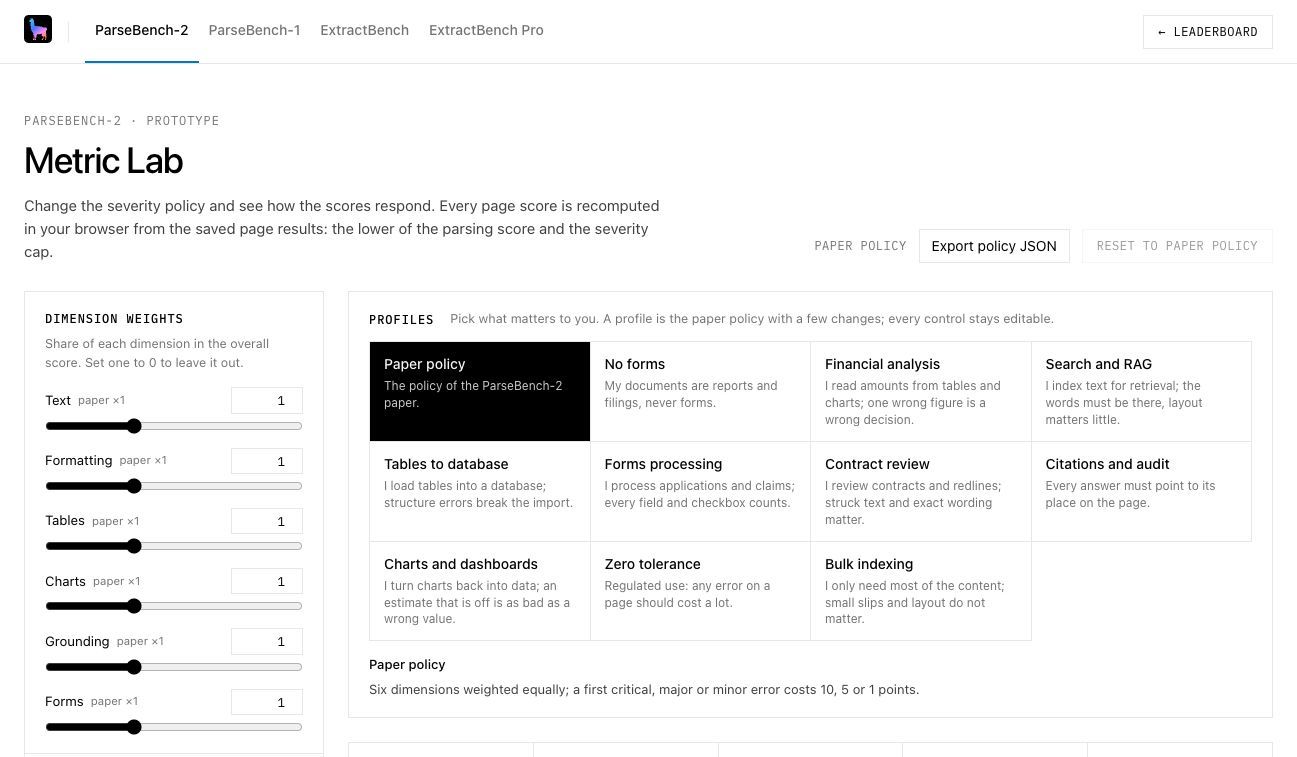
The Metric Lab prototype, captured November 16, 2026. Workload profiles provide starting points; the controls remain editable.
These controls separate how much a capability matters from how consequential an error is within it. Increasing the weight of forms changes its influence overall; increasing the severity of a field-association error changes how form outputs are evaluated. Users can inspect ranking sensitivity, export policies, and rescore saved evaluations.
The prototype supports error-type reclassification for tables, charts, and forms. Text and formatting primarily expose severity totals; visual-grounding scores remain fixed. Reweighting leaves detected errors and content-recovery scores unchanged, so removing a cap penalty may leave a content penalty. Detecting new errors requires modifying and rerunning the scorer.
Users can also extend the scenario suites to test new scoring rules against their own targets. This makes ParseBench a framework for developing metrics around a document distribution and set of preferences.
Remaining challenges
Ground-truth annotation remains difficult to scale. Nested headers, blank fields, reading order, and unlabeled chart values require consistent annotation conventions and review procedures that expose uncertainty. Making this process more efficient is an ongoing priority.
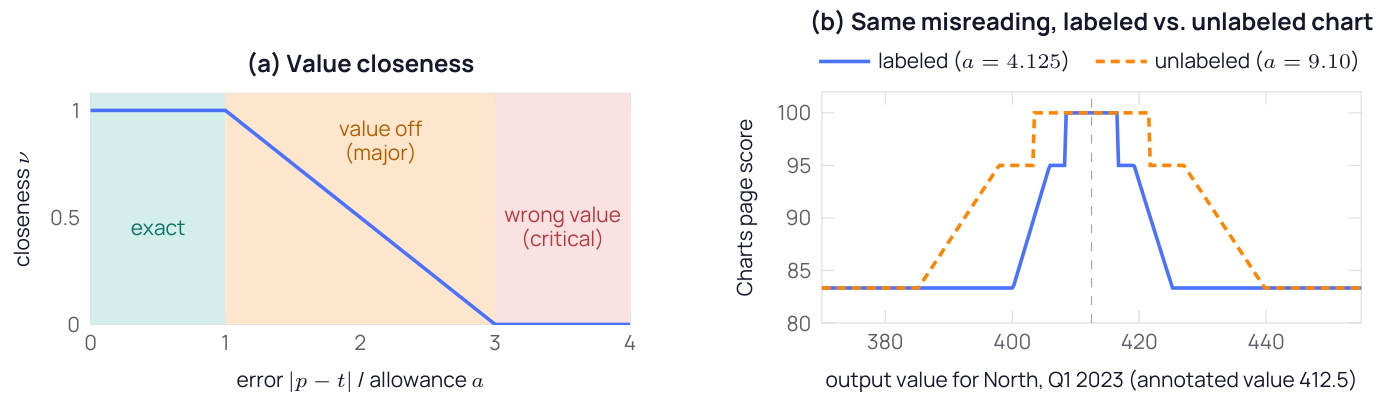
Printed chart values and values estimated from an axis support different levels of precision. ParseBench-2 accounts for this distinction through different tolerances. Report, Figure 9.
ParseBench-2 still contains annotation and scoring issues. We are publishing corrections, including fixes for supported representations and form matching, with results tied to the versions that produced them.
Severity also depends on context: the same numerical mistake can have different consequences across fields, and multiple errors can interact beyond what isolated perturbations capture. Evaluation against independent human judgments and downstream failures on new documents should help identify whether disagreements arise from annotations, severity policies, error detection, or aggregation.
We encourage readers to examine the technical report, try the Metric Lab, and share consequential errors the metrics underpenalize, equivalent representations they reject, or workloads requiring different severity policies.